STATISTICS IN PROFICIENCY TESTS
Based on the test results in a Proficiency Test (PT), each participant receives an indication of its performance. iis uses the z-score as the performance indicator, which gives an indication of the laboratories competence. Prior to calculation of the labs z-scores, certain statistical tests have to be applied. The statistical procedure of the Institute is based on international accepted documents (e.g. ISO 5725, ISO 43), with a number of sequential steps: |
| Detection of obvious errors | The test results of the participating laboratories are checked for obvious errors. A robust outlier test, Huber Elimination Rule, is used for this purpose. In case of erroneous results, the respective participant is notified immediately so it can take all necessary corrective actions. It is also to check the results. The notification of deviating results is done shortly after the closing date for sending in the results, normally within 2 days after deadline. Any corrected results replace the erroneous ones. In the final report the results sent in at first are mentioned as a remark. |
|
| Check on normal distribution of the test results | Many statistical procedures are only applicable to random samples from a population with a Gaussion (normal) distribution. Even the outcome of one of the most simple parameters, the mean, depends bly of the type of distribution of the data. Therefore, the reported test results are checked on normal distribution. Lilliefors test, a variant of the Kolmogorov-Smirnov test, is used. In case of anormality, the explicit warning to interpret the conclusions with caution is made in the final report. | |
| Detection and removal of statistical deviating and erroneous results | iis uses (almost) always in its Proficiency Tests natural matrix materials. The 'true values' in such a test item (e.g. concentrations or amounts) are not known. A good estimate of a 'true value' can be given by the mean of all test results. This in only true if the test results are normally distributed and if erroneous and other extreme results are removed from the data set prior to calculation of the mean. The detection of statistically deviating results is given thorough attention. The Institute uses 3 different numerical tests for the detection of outliers and stragglers: Cochrans' test, Dixons test and Grubbs (single and paired) test. Erroneous and all statistically deviating results are removed before summary parameters are calculated. | |
| Calculation of the summary parameters | The valid test results of the laboratories in the Proficiency Test are used to calculate the following parameters: mean, standard deviation of the repeatability (sr) and of the reproducibility (sR), repeatability (r) and reproducibility (R). If possible, the calculated repeatability and reproducibility of the group of participants are compared with the values given in the corresponding international accepted (ASTM, IP, ISO,DIN) standard test method. | |
| Calculation of the performance indicators (z-scores) | The international accepted z-score
is used as an indication of the performance of a participant. This score provides the lab
and also its management, its (potential) clients and accreditation bodies a good
indication of its analytical competence. For each test the z-score of lab i is calculated as: zi = (xi - X ) / s in which: xi is the result of lab i for that specific test X is the assigned value, an estimate for the 'true value'. iis tries to use in its Proficiency Tests real samples. This garantees a close resemblance between the PT-test items and the samples the participating laboratories normally analyse. The items do not have a known composition (e.g. concentrations or amounts). The mean of all valid lab results is used as the assigned value. s is the target standard deviation (of the reproducibility). This value is derived from the corresponding, internationally accepted test method, e.g. ASTM, IP, ISO, DIN or another accepted standard in the industry. Thus, the z-score calculation of iis results in a simple, straight forward comparison of a lab results with the reproducibility stated in the corresponding international accepted (ASTM, IP, ISO, DIN) test method. The interpretation of the z-scores is easy: |
|
| Graphical presentations of all results and z-scores | In order to visualise the test results against the reproducibility a plot is made for each test.
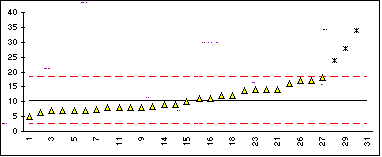
A single sample: a Gauss plot: On the Y-axis the sorted test results are plotted. The corresponding lab numbers are on the X-axis. Valid results are presented by a triangle, rejected results as an *. The mean and the reproducibility limits of the corresponding international accepted (ASTM, IP, ...) test method are presented by (dotted) lines. 
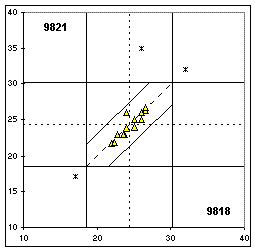
Two samples: a two-sample or Youden plot: On the X-axis the result for one sample is plotted and on y-axis the result for the other sample. Valid results are presented by a triangle, rejected results as an *. The means and repeatability and reproducibility limits are all presented by (dotted) lines. 
A Youden plot visualises systematic errors as well as random errors. If the results from the laboratories vary entirely because of random errors, the results will fall randomly around the average; approximately equal number of points will be present in each of the four quadrants. If systematic errors are the main cause of the variation, a predominance of points will be visible in the top right and the lower left quadrants of the plot. |
| All participants receive at the start of a Proficiency Test a complete and detailed description of the statistical procedure used by the Institute for Interlaboratory Studies. |
| go to the top of this page |


